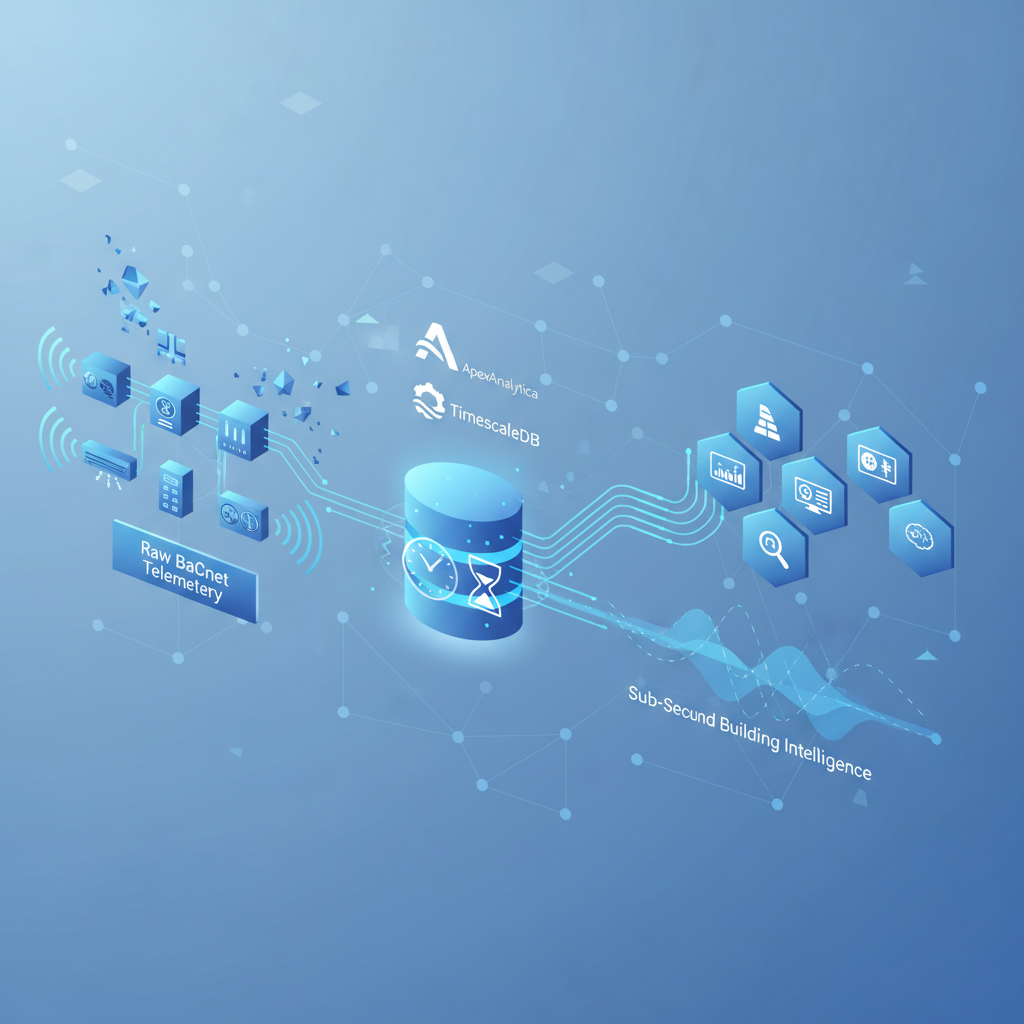
ApexAnalytica shows what happens when deep building automation expertise meets the right data infrastructure. A single developer with 25 years in BMS and smart buildings has built a production SaaS that ingests telemetry from 38 diverse sites—care homes, hotels, gyms, garden centers, offices, veterinary practices, and flexibility assets—and turns it into real-time analytics, ASHRAE-aligned fault detection, and AI-assisted insight.
By moving from vanilla Postgres to TimescaleDB hypertables and time_bucket-based materialized views, ApexAnalytica cut a critical 12‑month aggregation query from 6+ seconds to under a second. That one decision changes how facility managers and energy teams experience their data: instead of waiting for reports, they scrub a full year of hourly consumption patterns in a single, responsive heat map view.
From Unused BMS Telemetry to Actionable Building Intelligence
Most Building Management Systems produce a torrent of telemetry—half-hourly meter readings, 60‑second BMS point updates, IAQ data, and constant fault/alert streams—but very little of it drives decisions. It typically sits on head-end controllers, waiting for an engineer to look at the right point at the right time. ApexAnalytica was designed explicitly to close this gap and become the analytics layer the industry has been missing.
The platform connects to existing building automation and ICS infrastructure using standard protocols: BACnet, Tridium Niagara, Modbus TCP, MQTT, REST, and SQL Server. It then applies real-time analytics, ASHRAE Guide 36-aligned fault detection and diagnostics (FDD), and IPMVP-compliant M&V to expose where buildings are wasting energy or drifting out of spec. An AI agent sits on top, reasoning over live telemetry and building documentation to support engineers, facility managers, and energy managers.
In many ways, ApexAnalytica parallels the mission of platforms like BAaaS.io, which also seek to unify HVAC, metering, IAQ, and operational data into a single, secure building information sphere. Both approaches reflect the same trend in smart buildings: move from siloed BMS screens to portfolio-level, data-driven decision support.
The Heat Map Problem: When 12 Months of Telemetry Breaks Dashboards
The first real scalability pain point emerged on a deceptively simple feature: a 12‑month hourly heat map. The dashboard plots hour-of-day versus calendar day, rendering an entire year of meter consumption as a single visual so operators can instantly see weekend baselines, out-of-hours waste, and seasonal trends at a glance. On vanilla Postgres, the aggregation query driving this view consistently ran over six seconds.
Architecturally, the issue is familiar to anyone doing operational analytics on ICS or building telemetry. Raw half-hourly readings are stored in a wide table; generating hourly buckets for a year per building means scanning tens of thousands of rows every dashboard refresh. As the time window and meter count grow, cost scales linearly. ApexAnalytica hit the six-second threshold with just a single customer portfolio—clear signal that the existing stack would not survive real-world scaling.
For end users in smart buildings, six seconds is effectively failure: they assume the platform is broken, not slow. Sub-second interactions are what make energy analytics feel like an operational tool instead of a reporting system. This is where the decision to adopt TimescaleDB becomes pivotal.
Why TimescaleDB Won: One Postgres for Telemetry, Transactions, and RAG
Instead of standing up a separate time-series or OLAP engine, ApexAnalytica stayed within the Postgres ecosystem and chose TimescaleDB. That choice was heavily influenced by AI-assisted development—Claude Code recommended TimescaleDB based on the workload shape, the docs checked out in an evening, and the migration proceeded without a lengthy bake-off against InfluxDB or ClickHouse.
The key advantage is architectural coherence. TimescaleDB runs as a Postgres extension, so the same SQL that powers transactional state also powers time-series rollups. There is no second query language, no dual-write pipeline to keep analytical and operational stores in sync, and no extra security boundary to manage. For a one-person engineering team running a production smart building platform, that consolidation matters as much as raw performance.
In production, ApexAnalytica’s single Postgres instance now holds everything: high-ingest BMS telemetry (1,000–10,000 points per second), building metadata, user accounts, FDD rule sets, and the vector embeddings that power its RAG-based AI agent. This “one database, one backup, one boundary” approach is increasingly attractive across the building automation ecosystem, including to operators using platforms like BAaaS.io who want a unified, secured data plane instead of a sprawl of loosely coupled services.
Hypertables and Materialized Views: Sub-Second Heat Maps at Portfolio Scale
ApexAnalytica’s data pipeline starts at the building edge. Telemetry streams in over BACnet, Niagara, Modbus TCP, MQTT, REST, and SQL Server into a Node.js/TypeScript backend running on DigitalOcean Kubernetes. From there, raw half-hourly meter readings are written into a TimescaleDB hypertable with a 30‑day chunk interval. At the time of reporting, that hypertable spans 72 chunks and about 1.32 million rows.
Above that hypertable sits a family of materialized views. The workhorse view uses time_bucket to roll half-hourly readings into hourly buckets by building for the 12‑month heat map, while sibling views serve longer time windows and per-meter drill-downs. A custom Node.js service refreshes these materialized views every 15 minutes, orchestrated with a Redis-based distributed lock so multiple Kubernetes pods never refresh the same view concurrently. Crucially, refreshes run concurrently using REFRESH MATERIALIZED VIEW CONCURRENTLY, so dashboards are never blocked.
The performance impact is stark. The 12‑month hourly heat map now returns 5,452 pre-aggregated rows in under a second, where the equivalent raw query on vanilla Postgres would have scanned 65,000–130,000 half-hourly records. Operators gain the ability to scrub a year of data interactively, turning what used to be a slow, batch-style analytic into a live operational tool for smart building optimization and ICS performance tuning.
AI-Driven RAG and Operational Context Inside the Same Database
Beyond time-series analytics, ApexAnalytica embeds an AI agent—Ask Apex—that runs entirely inside the company’s own infrastructure. The agent uses RAG (Retrieval-Augmented Generation) to combine live telemetry with building documentation, FDD rules, and other contextual data to answer operational questions. Critically, the vector store backing this RAG layer lives in the same Postgres instance as the time-series and transactional data.
Four dedicated embedding tables keep content organized, but everything shares one database, connection pool, backup strategy, and security perimeter. That simplifies ICS security and governance: there is no separate vector database with its own access patterns and audit trail. For risk-conscious sectors like care homes, healthcare, and energy, this consolidation reduces both attack surface and compliance overhead.
This pattern mirrors what leading building automation platforms, including BAaaS.io, are starting to adopt: AI and RAG services that are tightly coupled with building data, not loosely bolted on via third-party APIs. Keeping telemetry, documentation, and embeddings co-located improves both latency and data protection, which is critical for regulated environments.
Single-Developer Architecture: Simplicity as a Scaling Strategy
The architectural choices behind ApexAnalytica are informed by the realities of a solo developer running production for six clients across 38 sites, with a pipeline targeting a 1,700‑property care and social housing estate. Every extra system—another database, another queue, another integration surface—adds cognitive and operational load. Consolidating on Postgres + TimescaleDB is as much a team-strategy decision as it is a technology choice.
By avoiding a dual-store architecture (one operational, one analytical), ApexAnalytica side-steps schema drift, ETL maintenance, and split-brain debugging between systems. There’s one backup window to manage, one schema to evolve, and one security boundary to audit. For many building automation teams—whether at integrators, FM providers, or digital twins vendors—this is a compelling blueprint for how to ship high-value analytics with constrained engineering capacity.
It also underscores how domain expertise, not just software experience, can drive innovation in smart buildings. With AI-assisted development helping on the TypeScript and Kubernetes side, a 25‑year building automation veteran has been able to design a full-stack, production-grade analytics and FDD platform that rivals work from much larger teams.
Roadmap: Net Zero Benchmarks, ASHRAE 231, and High-Frequency Lighting Data
The next phase of ApexAnalytica’s evolution pushes its time-series workload much harder. One roadmap item is a UK Net Zero Carbon Buildings Standard-aligned framework to benchmark multi-year, weather-normalized energy consumption across asset classes. That requires efficient rollups and comparisons across large portfolios, and TimescaleDB’s advanced aggregation capabilities will be central to delivering it.
Another focus is ASHRAE 231‑2026 Control Description Language, with auto-generated FDD rules whose execution scales as rules × points × query frequency. This demands careful query design and efficient scheduling to avoid overwhelming the database. Parallel to this, ApexAnalytica is working on a “single pane of glass” MSI data layer, pulling BMS, energy, IAQ, weather, and lighting data over UDMI on MQTT using Google’s Digital Buildings Ontology to model entities and relationships.
Lighting will likely be the stress test: per-fixture state changes at sub-second resolution across thousands of points per building can explode ingest volume and storage cost. To address this, ApexAnalytica plans to evaluate TimescaleDB continuous aggregates to replace the custom refresh service with incremental policies, and Hypercore compression to reduce storage on older chunks. These features are exactly the kind of tools portfolio-scale platforms—and building-cloud ecosystems like BAaaS.io—need when scaling from dozens to thousands of buildings while keeping cost and performance under control.
Conclusion
ApexAnalytica is a case study in how modern time-series tooling and AI-assisted development can unlock the value locked inside traditional BMS and ICS environments. By consolidating telemetry ingest, transactional state, and RAG embeddings into a single Postgres + TimescaleDB instance, it delivers sub-second, portfolio-grade analytics without the operational overhead of a multi-database architecture.
For facility managers, energy teams, and building automation specialists, the impact is tangible: a year of hourly consumption rendered instantly as a heat map, ASHRAE-aligned FDD running across diverse portfolios, and an AI agent that understands both live data and the underlying building documentation. As the platform expands into net zero benchmarking, ASHRAE 231 rule generation, and high-frequency lighting analytics, it offers a blueprint for how future-ready smart building platforms—and complementary ecosystems like BAaaS.io—can scale analytics, security, and AI without losing architectural simplicity.